
Page 18 - Flytxt
P. 18
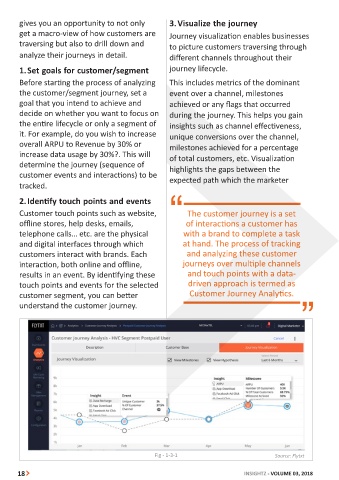
gives you an opportunity to not only                 3. Visualize the journey
        get a macro-view of how customers are                Journey visualization enables businesses
        traversing but also to drill down and                to picture customers traversing through

        analyze their journeys in detail.                    different channels throughout their

        1. Set goals for customer/segment                    journey lifecycle.

        Before starting the process of analyzing             This includes metrics of the dominant
        the customer/segment journey, set a                  event over a channel, milestones
        goal that you intend to achieve and                  achieved or any flags that occurred

        decide on whether you want to focus on               during the journey. This helps you gain
        the entire lifecycle or only a segment of            insights such as channel effectiveness,
        it. For example, do you wish to increase             unique conversions over the channel,
        overall ARPU to Revenue by 30% or                    milestones achieved for a percentage

        increase data usage by 30%?. This will               of total customers, etc. Visualization
        determine the journey (sequence of                   highlights the gaps between the
        customer events and interactions) to be

        tracked.                                             expected path which the marketer

        2. Identify touch points and events

        Customer touch points such as website,                     The customer journey is a set
        offline stores, help desks, emails,                       of interactions a customer has
        telephone calls… etc. are the physical                   with a brand to complete a task
        and digital interfaces through which                     at hand. The process of tracking
        customers interact with brands. Each                       and analyzing these customer

        interaction, both online and offline,                    journeys over multiple channels
        results in an event. By identifying these                  and touch points with a data-
        touch points and events for the selected                   driven approach is termed as

        customer segment, you can better                            Customer Journey Analytics.
        understand the customer journey.


                                                       Fig - 1-3-1                                Source: Flytxt


       18                                                                              INSIGHTZ - VOLUME 03, 2018